Injection velocity is one of the critical parameters in a molding process. Set the speed to incorrectly and there are many defects you can get such as flow marks, jetting, dieseling and weld lines. However if you optimize the velocity, your material viscosity can be consistent shot to shot and you are on the path to consistently good product. Determining the velocity that creates a consistent viscosity will allow you to setup a process that will last for years. Keep reading for an overview of developing a process and to get a Free Velocity Study Template.
Plastic is Non-Newtonian which means as the shear of the material changes the viscosity of the material will also change. In order to create a consistent process you have to understand when the viscosity experiences the least shear induced change. This is where a Velocity Study comes into play. A Velocity Study looks at the Relative Viscosity and Relative Shear Rate across the injection range of the press. Using the outputs from the press the Relative Viscosity and Relative Shear Rate can be calculated. Once these values are calculated for the injection range a selection can be made where the viscosity experiences the least amount of change as the velocity is changed.
Performing a Velocity Study
- Melt and mold temperature set to recommended range of the resin manufacturer.
- Set Injection Time Limit to a high value such as 20 seconds so to not accidentally trigger it.
- Set Cycle Time Limit to a high value such as 99 so to not accidentally hit it.
- Set the Injection Pressure Limit to the maximum available.
- Set the Hold Pressure and Time to 0 so there is no holding portion of the cycle.
- Set the Cooling Time to a safe value to makeup for no Hold Time.
- With the injection speed relatively low run a shot to ensure the part is not full.
- Set the shot size and transfer position to allow the injection speed to be increased without making a full part.
- Once the desired high injection speed has been reached adjust the transfer position to get a 95% full part. Ensure there is still a cushion at this point.
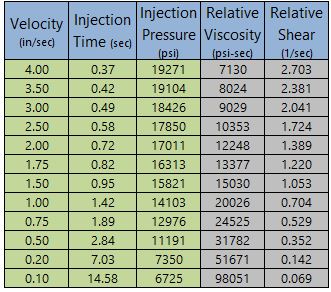
- When a 95% part can be repeatedly made cycle after cycle begin recording the injection time and maximum injection pressure at that injection speed.
- Lower the Injection speed a step (ex. 7 in/s to 6.5 in/s) and continue to record the corresponding injection time and maximum injection pressure.
- Keep lowering the injection speed until the injection time reaches around 10 seconds. It is recommended to have a fill time over 10 seconds to fill out the curve.
- Once all velocities have been tested and corresponding data has been recorded it is time to calculate the Relative Viscosity and the Relative Shear Rate.
- To calculate the Relative Viscosity take the Injection Time multiplied by the Injection Pressure for each Velocity tested.
- To calculate the Relative Shear Rate take 1 divided by the Injection Time.
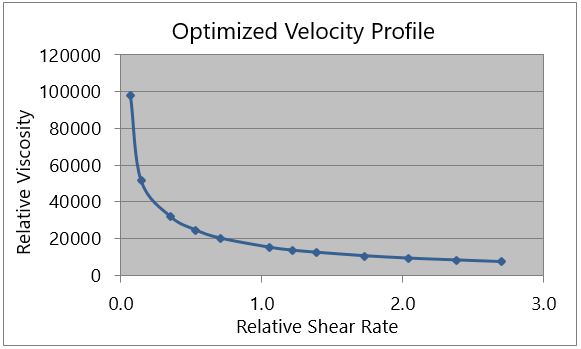
- In order to get the velocity curve plot the Relative Viscosity vs Relative Shear Rate.

Interpreting the results
- Looking at the plotted Relative Viscosity vs Relative Shear Rate will normally show the Relative Viscosity becomes more consistent as the Relative Shear increases.
- We are looking for our viscosity to be consistent and as the shear increases the change in viscosity decreases. This means that we are looking to select a spot along the curve that the curve begins to flatten out.
- We are selecting a spot that the curve becomes fairly consistent which means small variations of the material will not create big differences in viscosity.
- We do not want to select the highest/flattest point on the graph because there is no need to add unnecessary shear to the material.
- Look where the spot selected along the curve lines up with the Relative Shear Rate (note it does not have to be an exact point)
- Going back to the table look what injection speed corresponds with the Relative Shear selected. (it can be in between two Velocity test points)
- You now have your selected optimum velocity

Finalize your selection
- After completing a Velocity Profile and selecting your Optimum Velocity your 95% full part must be found again.
- Set your Injection Velocity and run a shot.
- Adjust the transfer position to get a 95% full part before turning hold pressure on.
- Ensure there is a cushion.
- Remember to lower the Maximum Injection Pressure Limit Safety as well as the Injection Time Limit to be slightly above the actual values.
Once you have completed your Velocity Study and determined your optimum velocity you are ready to move on to the hold phase of the Injection Molding Process. Make sure to thoroughly document your study including your data table, chart as well as the Shot size and Transfer Position at the beginning and end of your study. It is also beneficial to fill out a sheet documenting the rest of the process parameters such as barrel temperature, mold temperature, and back pressure so this Velocity Study can be better analyzed or reproduced in the future.