Determining an optimized Injection Molding Process is often an overlooked part of getting a product up and running. Getting the process right the first time however can save a lot of headache down the road. The first step to an optimized process is getting the Injection Velocity right.
Many materials come with recommended settings which often provide recommended Velocity ranges. These ranges are usually dictated by the flow characteristics of the specific material. To get a better idea of the velocity for your specific mold a Velocity Study should be performed.
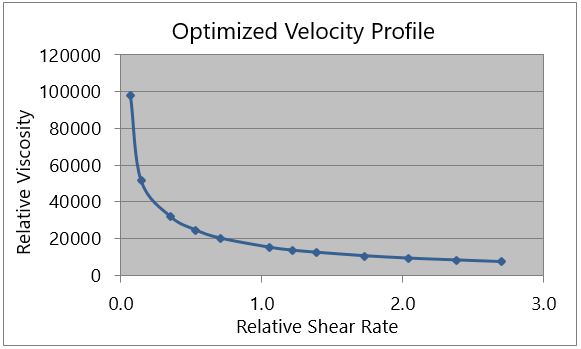
A Velocity Study is a simple step to perform and with some practice and understand not too difficult to interpret the results of either. To start with a Velocity Study looks at the Relative Viscosity versus the Relative Shear Rate of the material for your specific mold and machine setup. A Velocity Study consists of performing multiple sample runs at different velocities. For each velocity tested the fill time and injection pressure are used to determine the relative viscosity and relative shear rate.
The following images show an example collecting the required information for each shot and the corresponding Relative Viscosity and Relative Shear Rate for each velocity tested. These outputs are then plotted on a scatter plot to form a Viscosity Curve. Check out Image 1 below to see a Viscosity Curve example.

Ready to try it yourself? Download our DIY Velocity Study Excel Template to get started documenting your own Velocity Studies today.